
25 Dec Diverse opinions about cognitive process models
The survey Process Models in Judgment and Decision Making is an expert survey we conducted to find out about researchers’ opinion about the term “process model” and whether it applies to several models in the field. The main objective was to find out whether researchers’ agree or disagree about which models ought to be called “process model”.
We contacted 118 authors of well-known decision-making models per email and decision scientists via mailing lists (SJDM, largest decision science list, www.sjdm.org; list of the European Group of Process Tracing Studies, www.egproc.org).
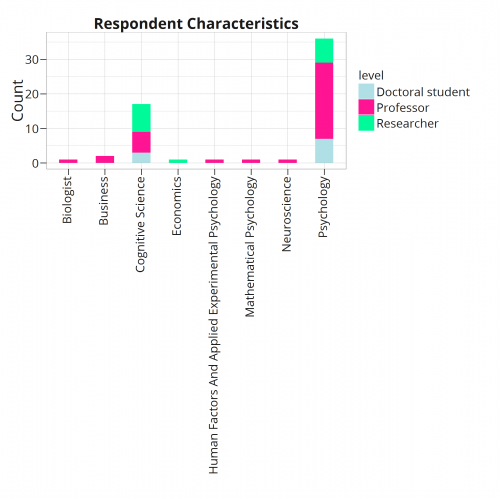
Respondents
The following results will appear in detail in our manuscript
Jarecki, J. B., Tan, J. H., & Jenny, M. A. (2015). What is a cognitive process model? A disambiguation. Working Paper [SSRN]
63 scholars replied (we excluded two master-students and one person for non-serious answering). The majority were at the level of a professor, followed by researchers (=post-docs, senior researchers or lecturers), and 10 doctoral students. Most had experience with teaching methods classes and they were rather familiar with the models, e.g. professors rated between 16 and 115 of the 116 models (mw=50).

Agreement
We expect high inter-rater agreement between respondents if they agreed on which models are process models. Overall agreement measured by Fleiss-Cuzick’s kappa (Fleiss & Cuzick, 1979) yields κ = .26, which must be considered low — values above .60 indicate “good” agreement. Agreement is low as well when computing the measure per seniority level (for professors, researchers, or doctoral students separately, κ reaches maximally .32 < .60).
These two plots illustrate the fact. If scientists shared their opinions whether models are process models, we expect to see a distribution of opinions over all models that takes the form of a step function.
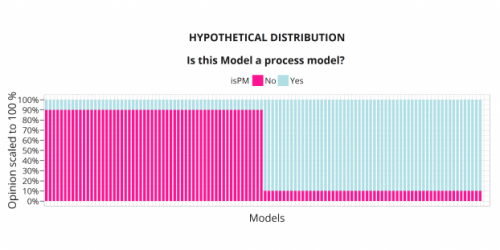
However, we see this distribution
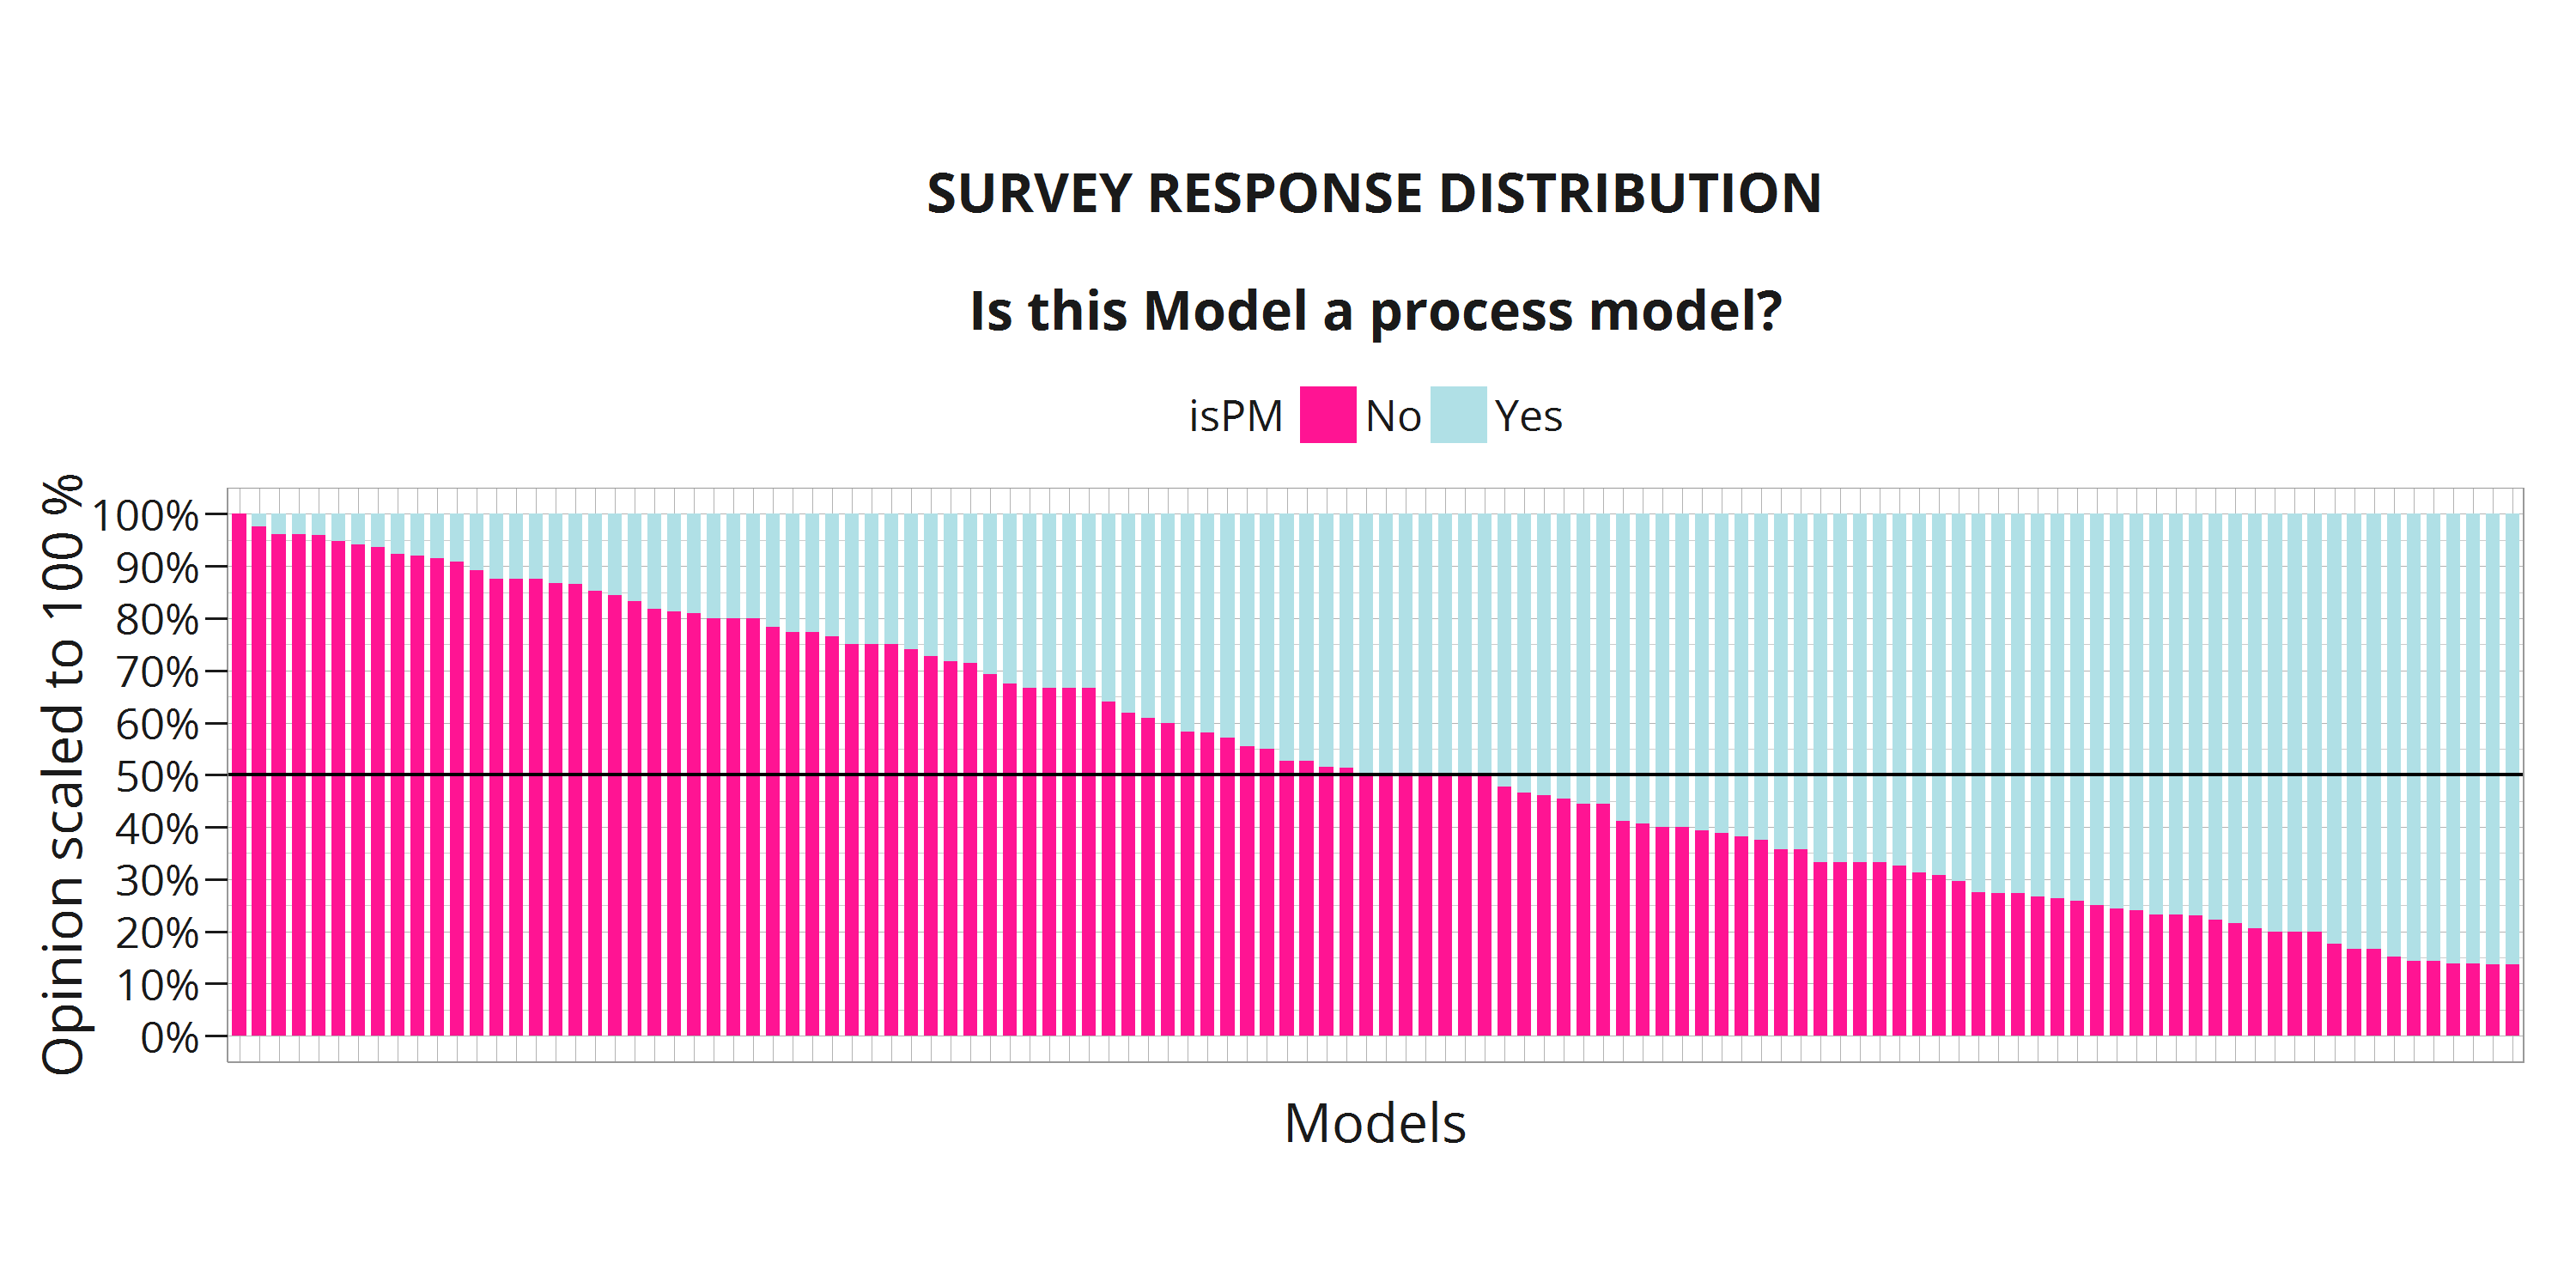
Note that for models which the majority regards as not process models there seems to be greater agreement (100 % in one case, the leftmost bar) than for models which seem to be considered process models by the majority (75 % agreement, the rightmost bar).
I am aware that it is possible to split these plots up by seniority — however I will refrain from showing more because these plots show percent agreement, which is an inadequate measure of rater agreement. Further the plots ignore the fact that some models are rated by many whereas other models are rated by few. The two plots above serve as mere illustration of the distribution of opinions.
If you have questions, drop me a mail.